# Overview
ChartWidget has a built-in interactive tooltip system designed to display relevant information about the displayed data and charts in response to user actions. It is based on the TooltipTool (tooltip identifier), which uses the selection callback to collect the data of interest to the user, and the tooltip callback to form a clear and descriptive tooltip:
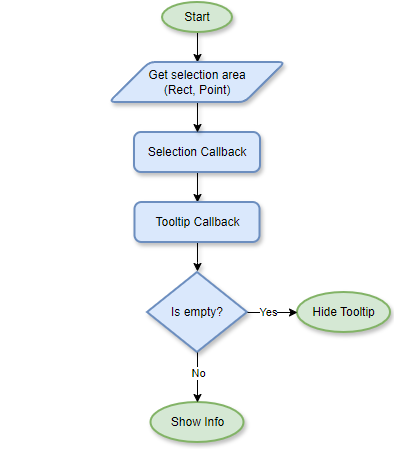
This is the default logic and can be changed if necessary. Also, both callbacks can be completely changed by the user, but in case of small edits they are exported in the module as defaultSelectionCallback and defaultTooltipCallback respectively. Let's look at them in more detail.
# Selection Callback
The purpose of the selection callback is to search for data located in the selected area provided by one of the input parameters. The return value is the SelectedItem array, which stores a separate chart as a sender and the corresponding data (data series identifiers and indices) as data.
To make the legend interactive, one of the check conditions is to search for legend items. If one is found, it is considered that the data represented by the corresponding item is selected. In addition, the algorithm takes into account the user ChartWidget selectionmode setting, which allows selection by vertical or horizontal line. In general, defaultSelectionCallback works as follows:
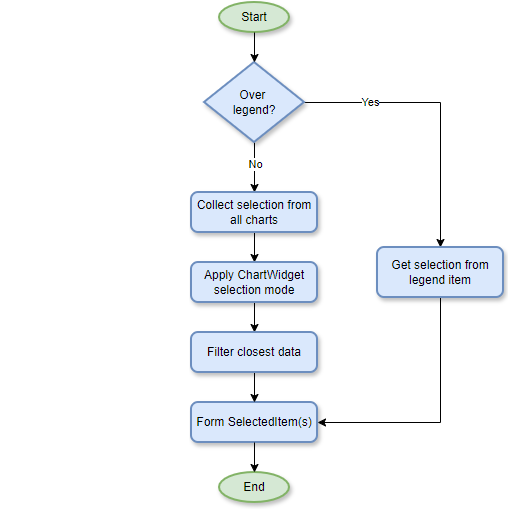
The user can write their own algorithm or add changes before or after the call, for example, to exclude highlighting for some events / when a certain button is pressed, or show highlighting of only one chart, etc. This callback also plays an important role in the default highlight algorithm. You can find more details about it here.
# Tooltip Callback
The tooltip callback purpose is to generate the display of the tooltip content based on the selected data received. Depending on the circumstances and preferences, the data can be presented in different forms: briefly, as a list, as a table, etc. To do this, the user can create their own callback and generate the content as they wish. However, at the moment, let's analyze available user parameters and the behavior of the defaultTooltipCallback, which groups data into lists relative to each chart:
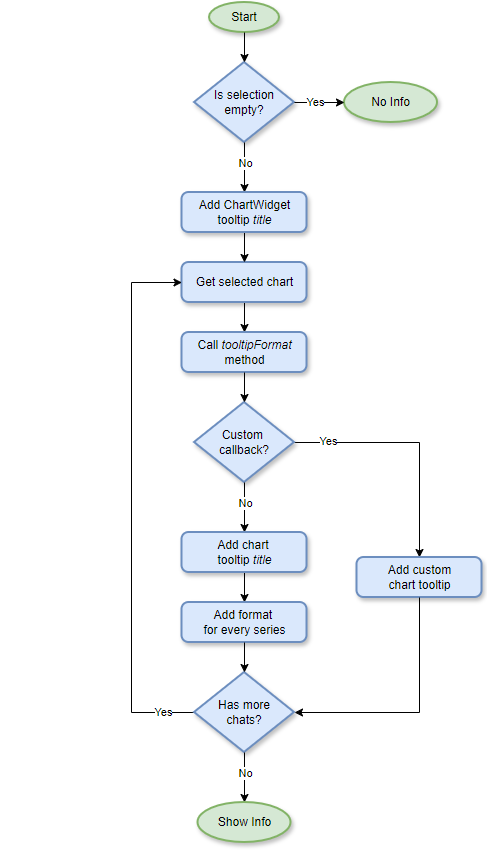
It is important to note that ChartWidget has a title parameter that goes into the title of the entire tooltip, while the individual title of a each chart tooltip titles the list of series specifically for it. Just as a user can rewrite the tooltip callback for the entire ChartWidget, he can change the algorithm for specific charts individually. By default, a chart generates a tooltip as a list of all series related to this chart and their values. This format can also be changed using a template string (both for the entire chart and for individual series).
In addition, the standard tooltip supports symbol (${symbol}) shapes for those charts that have them (which is the majority, for example, the CrossPlot chart). If possible, this symbol is placed in the center of the list to clearly illustrate the corresponding data. If the user wants to simplify the appearance of the list while preserving the displayed information about the color of the selected values, they can use the ${list} symbol, which creates a standard list element filled with the illustrated color.
For details, please see the tooltip tutorials.