# Overview
In some situations it makes sense to move away from the standard Cartesian visualization and arrange the data in a different form. For this purpose, a set of systems has been developed, defined by the corresponding parameter on widget initialization. From that point all added charts, axes, tools, etc. will work in the specified system.
Different systems may have different advantages and disadvantages. In general, the chart module was designed to support multiple systems with as minimal API changes as possible. This greatly simplifies the user's task, since he no longer needs to rebuild the scene taking into account the new approach, it is enough to change a single widget option.
In addition to the visuals, some interaction tools have also been reworked. For example, all systems have a unique crosshair view, built taking into account the features of the displayed data. More examples and descriptions of specific systems will be given below.
# Polar System
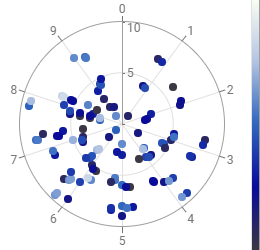
Polar System
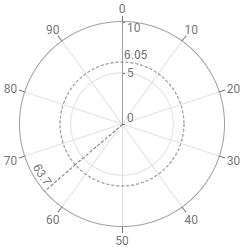
Polar CrossHair
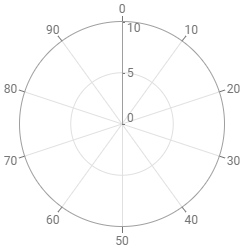
The Polar coordinate system is a two-dimensional coordinate system in which each point is determined by a distance from a reference point (center) and an angle from a reference direction. For this system, the x and y axes locations have been reworked (the colorbar z axes remain unchanged), with the vertical axes positioned as the radius of the displayed circle and the horizontal axes displayed along the circumference. The user can specify standard axis locations (West, South, etc.) or use PolarAnnotationLocation.
Similar to the default Cartesian system, the widget can have an arbitrary number of axes, specifying the angle and direction for the radial axes. The axes also support an interactive tickgenerator and a connected grid that forms circles (for the radial axis) or segments from the center to the ticks (for the circular case).
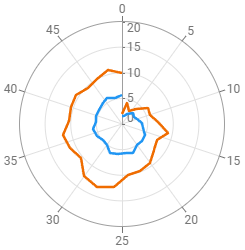
Polar LineChart
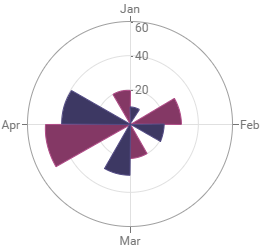
Polar BarChart
Polar CrossPlot
PolarSystem currently supports the main types of charts: LineChart (AreaChart, AreaRange Chart), BarChart (FloatingBarChart) and CrossPlot. Adding and configuring these charts is no different from the Cartesian system, for more details check the corresponding chart overview.
# Ternary System
Ternary System
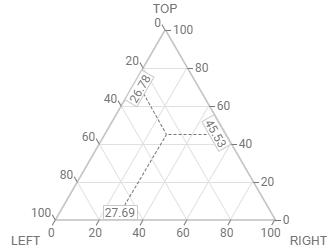
Ternary CrossHair
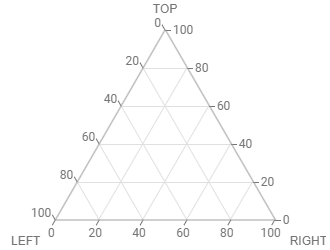
The Ternary system is made to support triangular diagram which displays the proportion of three variables that sum to a constant and which does so using barycentric coordinates. Unlike ChartWidget in CartesianSystem, the displayed area has the shape of an equilateral triangle and has exactly three axes (not counting an arbitrary number of colored z axes) with fixed locations:
Westhas a single axis starting at the top vertex of the triangle and ending at the bottom left corner. The axis title (if specified by the user) is automatically positioned at the bottom left point of the triangle.Easthas a single axis starting at the bottom left vertex of the triangle and ending at the bottom right corner. The axis title (if specified by the user) is automatically positioned at the bottom right point of the triangle.Northhas a single axis starting at the bottom right vertex of the triangle and ending at the top corner. The axis title (if specified by the user) is automatically positioned at the top point of the triangle.
To configure and connect these axes to charts, you need to add an axis in the standard way with one of the listed locations, its settings (including the identifier) will be applied to the corresponding instance. The axes also support interactive tickgenerator, the attached grids for these axes are automatically positioned at 60° angle parallel to one of the sides of the triangle.
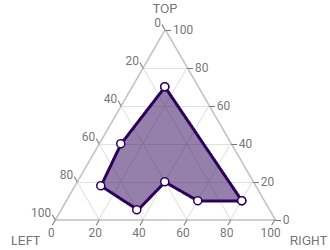
Ternary AreaChart
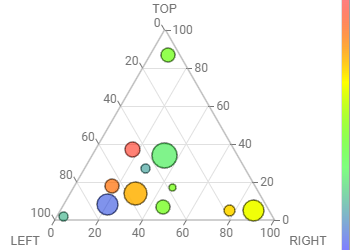
Ternary CrossPlot
Currently, the Ternary system supports two types of charts: LineChart (AreaChart, AreaRange Chart) and CrossPlot. Adding and configuring these charts is no different from the Cartesian system, for more details check the corresponding chart overview.