# Introduction
This overview describes the software architecture for FlowCharts.JS. The basic classes and methods designed to facilitate the implementation of FlowCharts are described below.
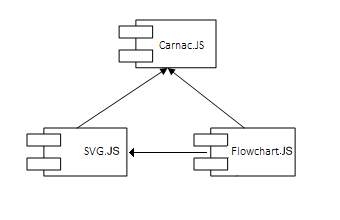
# Logical View
Below is a logical view of flowchart architecture.
# Diagram Widget
A DiagramWidget is the core of FlowchartsJS library. This widget encapsulates the API and tools for organizing and manipulating visuals inside of it. Every scene within FlowChartsJS may be treated as a graph. The graph can be non-directional or directional, depending on the type of links used.
# Diagram Visuals
A DiagramVisual is a proxy visual that contains a renderable prototype (any visual derived from geotoolkit/scene/Node) and contains a set of attributes and properties that may define relations to other Diagram Visuals using Links.
Each Diagram Visual has properties for the UI, such as search keywords, prototype name, icon (for UI) and so on. SvgDiagramVisual is used for SVG content.
It is very important to understand that DiagramVisual keeps the original geometry unchanged, and applies its own Local Transformation for proper rendering. Therefore, there is a big difference between an “internal” DiagramVisual model and an “external” model. For example, the entire geometry can fit into 1x1 model space, but having Local Transformation with scale(20, 20), the Diagram Visual will take 20x20 model units in the DiagramWidget’s model. At the same time, Diagram Visual prototype requires links points definition in inner model space. The goal of this is to make prototyping easier for end users. As an example, a geometry may have size 100 by 800, with possible link points in (50, 0) and (50, 400), but DiagramVisual will handle it and set size as required by the model.
DiagramVisuals are independent from each other and don’t know anything about each other. That said, DiagramVisual does not provide information about visuals linked to it. Links are not necessary until graph operations are required and therefore every link should be treated as Edge definition and every DiagramVisual should be treated as Vertex definition. This gives more freedom for graph processing and data organizing in applications. To connect visuals, a link should be used.
# Links
A Link can be a connecting line or a directional arrow. A link provides information about the direction of input and output between the DiagramVisuals it connects. The links can represent the following sequential order:
NoLinks – Visuals are connected but no flow can occur.
SingleLink – Flow direction is from the beginning of the link to its end.
DoubleLink – Flow is bi-directional, so it goes both ways.
FlowchartJS provides two types of Link visuals:
- LinkVisual: This link has two characteristics:
Straight link: Represents a straight arrow without any bends.
Smart link: Represents a stepped link that may avoid obstacles (other visuals) automatically using horizontal and vertical lines, until edited by a user. - PolylineVisual: This link represents an editable polyline and provides more freedom for editing. However, it is not a “smart” link and the user has to set it up point by point using API or UI Tools.