# Introduction
Welcome to the architectural overview of the SeismicJS module of GeoToolkit.JS. SeismicJS provides an API to view, interpret, edit, and process seismic data in web applications such as seismic QC, cross-section displays, velocity analysis or VSP applications. CarnacJS serves as the foundation for high-level toolkits like Seismic.JS as it is designed to facilitate the development of sophisticated 2D graphical web applications. The toolkit handles the complexity of graphics programming, including hardcopy output, object selection and editing, performance optimization, layouting and synchronization of complex plots, and it greatly simplifies the task of building the graphics displays required in scientific applications.
This document provides a comprehensive architectural overview of the Seismic toolkit, using a number of different architectural views to depict different aspects of the toolkit. It is intended to capture and convey the significant architectural decisions that have been made at the design time of the toolkit.
# Logical View
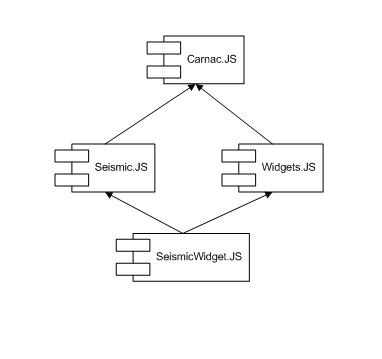
The following figure shows the relationship between components of the toolkit. Seismic module contains seismic widgets to simplify development of applications and a base seismic module that includes seismic data readers, data processing and seismic image to visualize seismic data. All these modules are based on Carnac.JS
# Seismic Data
The ability to read seismic data in different formats from different data sources is the key requirement for the seismic data visualization toolkit. There are dozens of different standards and proprietary formats existing today in E&P industry. The Seismic Toolkit breaks down seismic data into relatively simple definitions where the most basic primitive data type is called a trace that is a contiguous sequential collection of samples with an associated sampling interval or rate. A sample represents a single value at a particular time or depth. Lastly, a sequential collection of traces is called a reader. The Toolkit provides several implementations of readers to provide data from memory, from remote data source or from file.
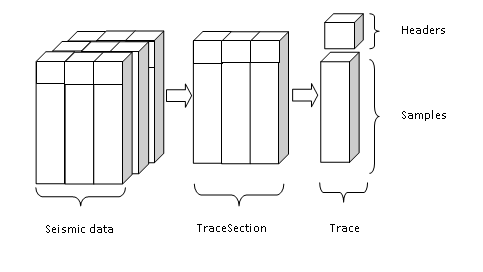
For better performance, the seismic reader splits a sequential collection of traces into groups which are called a trace section. A trace section contains traces and a trace consists of samples and trace headers.
The Seismic toolkit has a SeismicReader "interface" that is in uniform representation as a collection of traces and several implementations. The code demonstrates a simple initialization of the memory reader MemoryReader
import {MemoryReader} from '@int/geotoolkit/seismic/data/MemoryReader';

const createReader = function () {
    const sampleRate = 1;
    const sampleCount = 600;
    const traceCount = 500;

    const reader = new MemoryReader({
            'numberOfTraces': traceCount,
            'numberOfSamples': sampleCount,
            'sampleRate': sampleRate
        })
        .setTraceProcessor({
                'getTraceData': (reader, trace, traceId) => {
                    for (let i = 0; i < sampleCount; i++) {
                        trace[i] = Math.sin(( i / 10.0 + traceId / 4.0 ) * Math.PI);
                    }
                },
                'getDataStatistics': () => ({
                    'average': 0,
                    'min': -1,
                    'max': 1,
                    'rms': Math.sqrt(2)/2
                })
            }
        );
    return reader;
};
# Seismic Pipeline
Among the typical operations performed by the users on the seismic data, the first operation is reading the data. Then the user may want to select subset of data, apply one or more filters, scale data, choose the plot type, etc. Moreover, the user may want to create custom operations (filters) and apply them as well. To provide a flexible structure for processing of seismic data, Seismic.JS uses pipeline model. In this model, the seismic data processing pipeline is basically a chain of trace processes (operations) working on trace data (samples). The output data from the one trace process serves as the input data for the next process in pipeline. The diagram below represents an abstract model of the seismic pipeline structure. The corresponding image shows a schematic representation of pipeline.
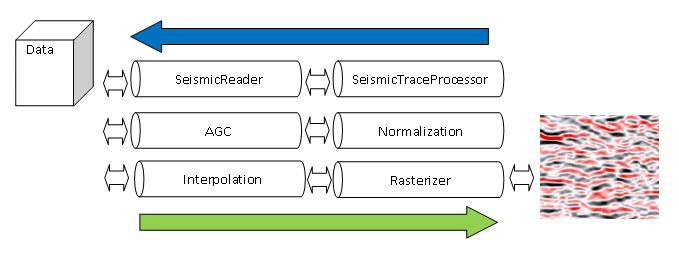
The blue arrow shows direction of requests from rendering system such as SeismicImage. It calculates invalid area and make request from rasterizer that finally makes asynchronous request from inner fetch manager that splits requests on trace sections (chunks) to seismic reader. The seismic reader provides requested trace sections. Internal fetch manager notifies pipeline that data is ready and green arrow shows a data flow from reader to custom trace processors based on SeismicTraceProcessor to rasterizer. It happens for each requested trace section. The interpolation and normalization processors are embedded to rasterizer for better performance. The custom automatic gain control (AGC) can be applied as well.
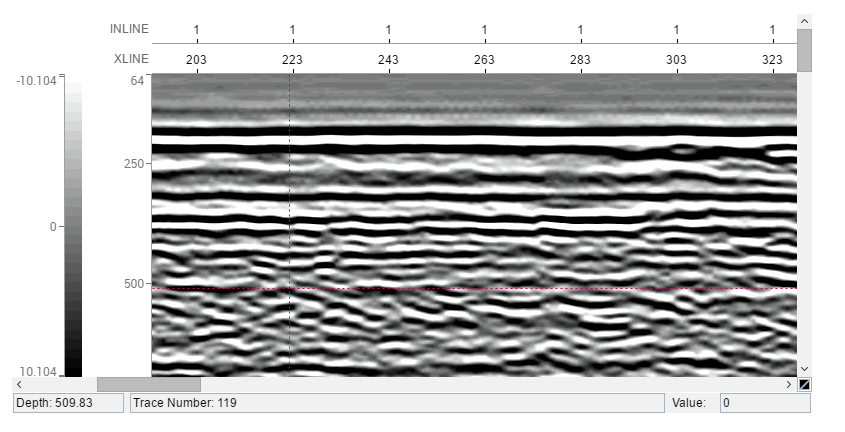
# Seismic Visualization
Seismic toolkit provides several visuals and widgets to visualize a result of the seismic processing. The high-level components are called widgets to simplify developing of the typical seismic displays. SeismicWidget includes time or depth axis, trace axis or a set of the trace headers axes. Moreover it contains optional color bar and table to display trace headers values. In most cases it is enough to use widget directly, but sometimes it is necessary to create a more complex display like base map, where seismic can be located by same angle and position inside the display. For this tasks the seismic image SeismicImage can be used.
# References
Seismic Widget demonstrates step by step initialization of the SeismicWidget.