GeoToolkit.JS is a powerful library used to develop interactive client web applications in 2D and 3D. The library uses HTML5 Canvas — pure JavaScript. The library runs across various web browsers, platforms, and devices without any additional plug-ins. It also supports Angular, React, Vue, Node.JS frameworks and provides TypeScript headers.
GeoToolkit may depend on other libraries such as three.js or react-native. Full list of dependencies and its versions can be found in package.json
GeoToolkit.JS helps build graphics displays for scientific, business, or process control applications. It simplifies tasks such as hardcopy output, object selection and editing, performance optimization, and layout and synchronization of complex plots.
CarnacJS is the core package and is always included. The other packages are optional and are included according to the purchased licenses. Each package is provided as a set of JavaScript modules pointed to obfuscated modules from libraries located in bin/impl folder and TypeScript headers in the same tree structure in bin. Each file represents one module. The list below shows the packages and their descriptions.
It is recommended to use tool such as rollup.js or Webpack, which allow bundling up all of your dependencies automatically and apply tree shaking of your code.
Also, Please use only the public API available in class documentation and refrain from using any private data members or obfuscated methods.
The icon/image assigned to a demo or tutorial will indicate which framework it is built with, for example:
React will be indicated with the icon 
Angular will be indicated with the icon 
Vue will be indicated with the icon 
# GeoToolKit Modules
Core graphics toolkit-CarnacJS: Provides the base graphics framework. Has a large variety of primitive shapes, attributes, charts and widgets. Widgets are high-level reusable graphics components which are easily extended to consume custom data sources.
Seismic toolkit-SeismicJS: Provides libraries to view, edit, and manipulate seismic data.
WellLog toolkit- WellLogJS: Provides components to display and manipulate welldata, including deviated wells.
Schematics toolkit- SchematicsJS: Provides display components and data object models for wellbore schematics visualization.
Gauges toolkit- GaugesJS: Provides implementation for different types of Gauges and its components.
Carnac3D: Provides a display foundation of 3D graphics components.
MapJS: Provides a high level single map component. This component is a collection of the different map.
ContourJS: Provides gridded or triangulated surface and visualizes it as a set of contours.
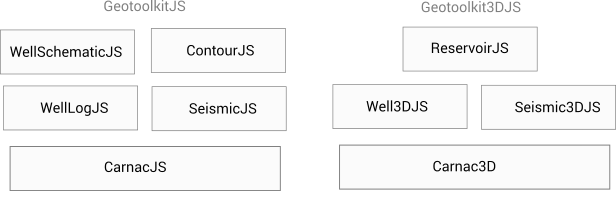
The illustration below shows the relationships between the GeoToolkit packages
# Browsers
GeoToolkitJS supports latest versions of the following browsers. For compatibility with a specific version please contact customer support.
- Chrome
- Microsoft Edge
- Firefox
- Safari
- Safari (Mobile)
# Platforms and Devices
- iPad 2 and up, iPhone
- Android devices
- Linux, Windows, Mac
# Carnac3D Requirements
The Carnac3D module will work on any device with WebGL2 capabilities.
Starting with Toolkit version 4.1, WebGL1 is no longer supported, but all up to date browsers now support WebGL2.
The current version of the Carnac3D module requires the Three.js javascript library.
Please see this page for more detailed information on 3D dependencies and installation.