# Introduction
The widgets components are part of a higher-level visualization framework, built using the GeoToolkit.JS. The WellLog Widget was designed to address the most common features required by well log display applications and minimize time to create these applications. It contains a predefined functionality, which can be extended using underline GeoToolkit.JS
This overview describes the software architecture for a set of JavaScript libraries included in WellLogWidget.JS, which contains higher-level components for Well Log Visualization. Widget runs in a Web browser using HTML5 technologies.
# Architecture
The following figure shows the relationship between components of the toolkit and widgets.
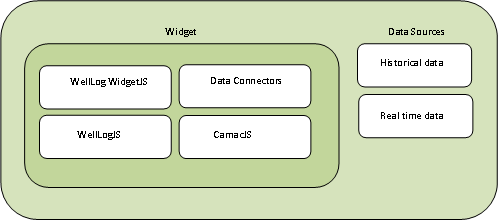
Widget uses a very specific domain modeling objects from WellLog Toolkit such as curve, lithology, track to visualize log data and in addition, it includes layer for data connectors to provide data for visualization.
# Data
The WellLog Widget provides API to connect your own data, which can be located on different servers. This API includes base data model, which represents hierarchical data structure (the data is organized into a tree-like structure) and located in memory and a set of data-binding, which associates an instance of visual like curve with data. How the data is delivered from server to memory of your application is not fixed. In addition, the widget allows adding data directly to visuals.
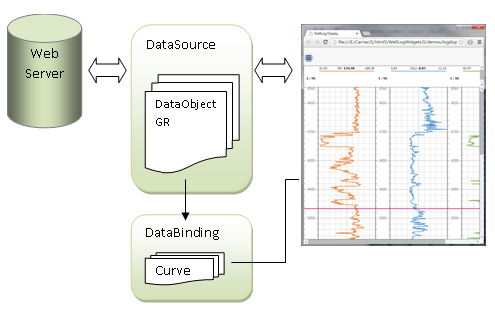
In the picture above, the data source implementation communicates with web service using AJAX or WebSockets and keeps temporary received data in data objects. The data source is connected to WellLogWidget. The WellLogWidget contains a set of data-binding functions to connect data object with visual, which are called if a template is changed or visual is added or removed from the widget.
- DataSource - an abstract data model, which contains data objects DataObject
- DataBinding - contains methods to connect and disconnect dataobject from the visual
The NumericalDataSeries can be used to keep values for each curve and indices (depths or time) in one DataSource. The next step is to connect data to widget. The code below shows an example how to do it:
import {NumericalDataSeries} from '@int/geotoolkit/data/NumericalDataSeries';

data.addChild(
    new NumericalDataSeries({
        'name': 'GR',
        'id': 'GR',
        'unit': 'INS',
        'data': array
    }));
widget.setData(data);
The data-binding tells how to bind your data with instance of curve. The code below shows custom data binding, which connects an instance of the curve with your data source. The method bind takes id of the curve and uses curve mnemonic to connect data:
import {LogCurve} from '@int/geotoolkit/welllog/LogCurve';

class CurveBinding {
    accept (node) {
        return node instanceof LogCurve;
    }
    bind (curve, data) {
        var that = this;
        if (curve.getDataSource() != null) curve.getDataSource().clear();
        // Sets data source
        curve.setData(data.getCurveSource(curve.getId()), true,true);
    };
}
// Add data binding for curve
widget.getDataBinding().add(new CurveBinding());
# Templates
The WellLog Widgets-based applications can use templates in JSON format to specify tracks, curves and other objects properties. The following code shows a simple template for creating two tracks and display a log curve in one. To apply a template it is necessary to call loadTemplate() on widget.
const template = {
    "template": {
        "type": "welllog",
        "tracks": [
            { "name": "Track # 0", "type" : "index" },
            { "name":  '"Track # 1", "type": "linear",
              "visuals": [
                  {"cg_type": "curve", "name": "CALI" }
              ]}
        ]
    }
};
widget.loadTemplate(template);
The part of the schema, which covers the JSON below can be found in jschema.js, can be specified using JSON Schema JSON Schema
Widgets parses this template. It is possible to specify the predefined types of the track: "index", "linear", "log", "tangential", "annotated", "custom".
- "index" - index track time or depth
- "linear" - linear track
- "log" - logarithmic track
- "tangential" - tangential track
- "custom" - empty track
Each track can support a collection of visuals
{
    "template": {
        "type": "welllog",
        "tracks": [{
            "name": "Track # 1",
            "type": "linear",
            "visuals": [{
                "cg_type": "curve",
                "name": "CALI"
           }]
       }]
    }
}
cg_type specifies the type, which is used by widget to create an instance of the visual. It can be:
- curve - create a log curve
- fill - create a log fill
- ClassName - where ClassName any geotoolkit class name like geotoolkit.welllog.LogCurve
Each track can have the optional axis section to specify property of the axis
{
    "template": {
        "type": "welllog",
        "tracks": [{
            "name": "Track # 1",
            "type": "linear",
            ...
            "axis": {
            ...
            }
       }]
    }
}
Each track can have the optional grids section to specify property of the grid lines for values and indices
{
    "template": {
        "type": "welllog",
        "tracks": [{
            "name": "Track # 1",
            "type": "linear",
            ...
            "grids": {
                "index": [
                    { .. }
                ],
                "value": [
                    { .. }
                ]
           }
       }]
    }
}