This tutorial shows the transformations used in the CarnacJS scene graph to display shapes in the browser window. GeoToolkit uses affine transformations, which can represented by 3x3 matrices.
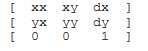
This is the system of homogeneous coordinates commonly used in computer graphics. The transformation of a vector (x,y) is represented as a matrix product.
A good reference for such transformations is Foley and van Dam:
J.D. Foley, A. van Dam, S.K. Feiner, J.F. Hughes. “Computer Graphics. Principles and Practice,” Addison-Wesley Publishing Company, Appendix: Mathematics for Computer Graphics: 1083-1112, 1990
In CarnacJS, the class geotoolkit/util/Transformation is used to implement such affine transformations.
# Scenegraph Without Any Transform
The examples in this page will use the below scene graph to demonstrate various transformations.
The next canvas shows this scene graph displayed without using any transformations.
import { Polygon } from "@int/geotoolkit/scene/shapes/Polygon.ts";
import { Rectangle } from "@int/geotoolkit/scene/shapes/Rectangle.ts";
import { Plot } from "@int/geotoolkit/plot/Plot.ts";
import { Group } from "@int/geotoolkit/scene/Group.ts";
import { KnownColors } from "@int/geotoolkit/util/ColorUtil.ts";
function createScene(canvas) {
  const triangle = new Polygon({
    "x": [50, 50, 100],
    "y": [50, 200, 200],
    "linestyle": {
      "color": KnownColors.Blue,
      "width": 3
    },
    "fillstyle": KnownColors.LightBlue
  });
  const rectangle1 = new Rectangle({
    "left": 25,
    "top": 25,
    "right": 225,
    "bottom": 225,
    "linestyle": KnownColors.Orange
  });
  const group1 = new Group().addChild([triangle, rectangle1]);
  const rectangle2 = new Rectangle({
    "left": 0,
    "top": 0,
    "right": 300,
    "bottom": 300,
    "linestyle": {
      "color": KnownColors.LightGray,
      "width": 10
    }
  });
  return new Plot({
    "canvaselement": canvas,
    "root": new Group().addChild([rectangle2, group1])
  });
}
export { createScene };

createScene(document.querySelector('[ref="plot"]'));
# Local Transforms
All CarnacJS shapes and groups inherit from geotoolkit/scene/AbstractNode. This base class, AbstractNode, has a property called 'LocalTransform'. The AbstractNode class has methods such as 'translate', 'rotate', and 'scale' that manipulate this transformation. In this next canvas, Group group1, the group containing the blue triangle and the orange rectangle, is translated by (50,0).
import { Polygon } from "@int/geotoolkit/scene/shapes/Polygon.ts";
import { Rectangle } from "@int/geotoolkit/scene/shapes/Rectangle.ts";
import { Plot } from "@int/geotoolkit/plot/Plot.ts";
import { Group } from "@int/geotoolkit/scene/Group.ts";
import { KnownColors } from "@int/geotoolkit/util/ColorUtil.ts";
function createScene(canvas) {
  const triangle = new Polygon({
    "x": [50, 50, 100],
    "y": [50, 200, 200],
    "linestyle": {
      "color": KnownColors.Blue,
      "width": 3
    },
    "fillstyle": KnownColors.LightBlue
  });
  const rectangle1 = new Rectangle({
    "left": 25,
    "top": 25,
    "right": 225,
    "bottom": 225,
    "linestyle": KnownColors.Orange
  });
  const group1 = new Group().addChild([triangle, rectangle1]).translate(50, 0);
  const rectangle2 = new Rectangle({
    "left": 0,
    "top": 0,
    "right": 300,
    "bottom": 300,
    "linestyle": {
      "color": KnownColors.LightGray,
      "width": 10
    }
  });
  return new Plot({
    "canvaselement": canvas,
    "root": new Group().addChild([rectangle2, group1])
  });
}
export { createScene };

createScene(document.querySelector('[ref="plot"]'));
# Contents Transform
The Group class introduces the concepts of model limits and bounds. The Group defines the Contents transformation to be the transformation from modelLimits to bounds. The Contents transformation cannot be set directly, but it can be set indirectly by changing either the modelLimits or the bounds. If either the modelLimits or the bounds are not set on a Group, the Contents transformation is simply an identity transform.
This canvas shows the scene graph only using a contents transformation. On group1, the modelLimits and bounds properties are set.
import { Polygon } from "@int/geotoolkit/scene/shapes/Polygon.ts";
import { Rect } from "@int/geotoolkit/util/Rect.ts";
import { Rectangle } from "@int/geotoolkit/scene/shapes/Rectangle.ts";
import { Plot } from "@int/geotoolkit/plot/Plot.ts";
import { Group } from "@int/geotoolkit/scene/Group.ts";
import { KnownColors } from "@int/geotoolkit/util/ColorUtil.ts";
function createScene(canvas) {
  const triangle = new Polygon({
    "x": [0.5, 0.5, 1],
    "y": [0.5, 2, 2],
    "linestyle": {
      "color": KnownColors.Blue,
      "width": 3
    },
    "fillstyle": KnownColors.LightBlue
  });
  const rectangle1 = new Rectangle({
    "left": 0.25,
    "top": 0.25,
    "right": 2.25,
    "bottom": 2.25,
    "linestyle": KnownColors.Orange
  });
  const group1 = new Group().setBounds(new Rect(0, 0, 300, 300)).setModelLimits(new Rect(0.25, 0.25, 2.25, 2.25)).addChild([triangle, rectangle1]);
  const rectangle2 = new Rectangle({
    "left": 0,
    "top": 0,
    "right": 300,
    "bottom": 300,
    "linestyle": {
      "color": KnownColors.LightGray,
      "width": 10
    }
  });
  return new Plot({
    "canvaselement": canvas,
    "root": new Group().addChild([rectangle2, group1])
  });
}
export { createScene };

createScene(document.querySelector('[ref="plot"]'));
# World Transform
The Group class defines the World transformation to be the product of the localTransform and the Contents transform. The canvas below shows the scene graph while using both a localTransform and a Contents transform. Thus, it has a non-trivial World transformation. In this case, the modelLimits and the bounds on the Group group1 are defined and also a translate(50,0) has been applied to group1.
import { Rect } from "@int/geotoolkit/util/Rect.ts";
import { Rectangle } from "@int/geotoolkit/scene/shapes/Rectangle.ts";
import { Plot } from "@int/geotoolkit/plot/Plot.ts";
import { Polygon } from "@int/geotoolkit/scene/shapes/Polygon.ts";
import { Group } from "@int/geotoolkit/scene/Group.ts";
import { KnownColors } from "@int/geotoolkit/util/ColorUtil.ts";
function createScene(canvas) {
  const triangle = new Polygon({
    "x": [0.5, 0.5, 1],
    "y": [0.5, 2, 2],
    "linestyle": {
      "color": KnownColors.Blue,
      "width": 3
    },
    "fillstyle": KnownColors.LightBlue
  });
  const rectangle1 = new Rectangle({
    "left": 0.25,
    "top": 0.25,
    "right": 2.25,
    "bottom": 2.25,
    "linestyle": KnownColors.Orange
  });
  const group1 = new Group().setModelLimits(new Rect(0.25, 0.25, 2.25, 2.25)).setBounds(new Rect(0, 0, 300, 300)).addChild([triangle, rectangle1]).translate(50, 0);
  const rectangle2 = new Rectangle({
    "left": 0,
    "top": 0,
    "right": 300,
    "bottom": 300,
    "linestyle": {
      "color": KnownColors.LightGray,
      "width": 10
    }
  });
  return new Plot({
    "canvaselement": canvas,
    "root": new Group().addChild([rectangle2, group1])
  });
}
export { createScene };

createScene(document.querySelector('[ref="plot"]'));
# Scene Transform
The Group class also has a scene transformation. This is the transformation from the model of a particular Group up to the root of the scene graph. Thus, this transformation is the product of the World transforms starting at the given node up the scene graph to the root. For example, the scene transform at node 1 is W0*W1 where W1 is the world transform at node 1, and W0 at node 0 (the root).