Groups are containers for nodes in the scene graph. Nodes may be either shapes or groups and are arranged in a hierarchical graph (the scene graph). See the Create Groups tutorial.
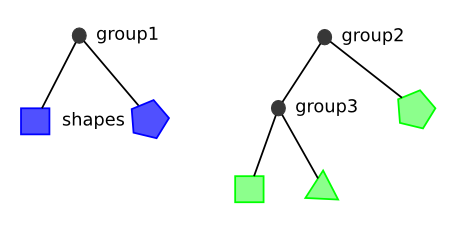
A modification applied to a group will recursively affect all of the children of the group. Referring to the above diagram, if a scale is applied to group1, the blue square and pentagon will be scaled. Likewise, if a scale is applied to group2, the green square, triangle, and pentagon will be scaled.
Applying a transform is another example of such a modification of a group; further examples of transforms can be found in the Transforms tutorial. See the Create Groups tutorial for group and rectangle creations. Image preloading is explained in the Images tutorial.
# Scaling A Group
When a group is scaled, all of its children are scaled with it. The group's bounds are also scaled by the scale factor. Note that any node in the scenegraph (AbstractNode) can be scaled as well as groups. In the below code, the empty rectangle with dashed lines is contained in the original (unscaled) group. The lightOrangeGroup and the orangeGroup are both scaled.
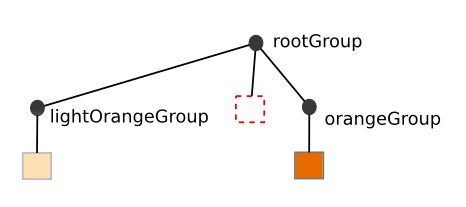
The resulting canvas is below.
import { Patterns } from "@int/geotoolkit/attributes/LineStyle.ts";
import { Rectangle } from "@int/geotoolkit/scene/shapes/Rectangle.ts";
import { Plot } from "@int/geotoolkit/plot/Plot.ts";
import { Group } from "@int/geotoolkit/scene/Group.ts";
import { KnownColors } from "@int/geotoolkit/util/ColorUtil.ts";
function createScene(canvas) {
  const rectangle = new Rectangle({
    "left": 50,
    "top": 50,
    "width": 100,
    "height": 100
  });
  const lightOrangeGroup = new Group().addChild([
    rectangle.clone().setLineStyle({
      "color": KnownColors.Gray,
      "pixelsnapmode": { "x": true, "y": true }
    }).setFillStyle(KnownColors.LightOrange)
  ]).scale(0.7, 1.5);
  const orangeGroup = new Group().addChild([
    rectangle.clone().setLineStyle({
      "color": KnownColors.DarkGray,
      "pixelsnapmode": { "x": true, "y": true }
    }).setFillStyle(KnownColors.Orange)
  ]).scale(1.5, 0.7);
  const rootGroup = new Group().addChild([
    lightOrangeGroup,
    orangeGroup,
    rectangle.clone().setLineStyle({
      "color": KnownColors.Red,
      "pixelsnapmode": true,
      "pattern": Patterns.Dash
    }).setFillStyle(null)
  ]);
  return new Plot({
    "canvaselement": canvas,
    "root": rootGroup
  });
}
export { createScene };

createScene(document.querySelector('[ref="plot"]'));
# Clipping Groups
If a group should not render anything beyond its bounds, then clipping can be used to clip all rendering at the group's bounds. In the example below, the blue square overflows the bounds of the group and is clipped. The dashed rectangle shows the bounds of the group with clipping enabled. The light blue shows the shape that is clipped.
import { Patterns } from "@int/geotoolkit/attributes/LineStyle.ts";
import { Rectangle } from "@int/geotoolkit/scene/shapes/Rectangle.ts";
import { Plot } from "@int/geotoolkit/plot/Plot.ts";
import { Group } from "@int/geotoolkit/scene/Group.ts";
import { KnownColors } from "@int/geotoolkit/util/ColorUtil.ts";
import { Rect } from "@int/geotoolkit/util/Rect.ts";
function createScene(canvas) {
  const groupToClip = new Group().setBounds({
    "x": 20,
    "y": 20,
    "width": 200,
    "height": 200
  }).setModelLimits(new Rect({
    "x": 0,
    "y": 0,
    "width": 200,
    "height": 200
  })).setLineStyle({
    "color": KnownColors.Red,
    "pixelsnapmode": true,
    "pattern": Patterns.Dash
  }).enableClipping(true);
  groupToClip.addChild([
    new Rectangle({
      "left": 50,
      "top": 50,
      "width": 200,
      "height": 200,
      "linestyle": {
        "color": KnownColors.DarkGray,
        "pixelsnapmode": true
      },
      "fillstyle": KnownColors.Blue
    })
  ]);
  const rootGroup = new Group().addChild([
    new Rectangle({
      "left": 70,
      "top": 70,
      "width": 200,
      "height": 200,
      "fillstyle": KnownColors.LightBlue
    }),
    groupToClip
  ]);
  return new Plot({
    "canvaselement": canvas,
    "root": rootGroup
  });
}
export { createScene };

createScene(document.querySelector('[ref="plot"]'));
# Clipping Groups By Path
In addition to clipping by group bounds, a group can be clipped by custom geometry, which can be defined with GraphicsPath. In the example below, the blue rectangle and image are clipped by path, which is set up to the parent group.
import { GraphicsPath } from "@int/geotoolkit/renderer/GraphicsPath.ts";
import { ClipStyle } from "@int/geotoolkit/attributes/ClipStyle.ts";
import { Image } from "@int/geotoolkit/scene/shapes/Image.ts";
import { AnchorType } from "@int/geotoolkit/util/AnchorType.ts";
import { Rectangle } from "@int/geotoolkit/scene/shapes/Rectangle.ts";
import { Plot } from "@int/geotoolkit/plot/Plot.ts";
import { Group } from "@int/geotoolkit/scene/Group.ts";
import { KnownColors } from "@int/geotoolkit/util/ColorUtil.ts";
import intImage from "/src/assets/images/slb-134x80.png?import";
function createScene(canvas) {
  const clippingPath = new GraphicsPath().moveTo(120, 100).lineTo(70, 200).lineTo(170, 200).lineTo(220, 100).close();
  const groupToClip = new Group().enableClipping(true).setClipStyle(new ClipStyle(clippingPath)).addChild([
    new Rectangle({
      "left": 50,
      "top": 50,
      "width": 200,
      "height": 200,
      "fillstyle": KnownColors.Blue
    }),
    new Image({
      "x": 50,
      "y": 120,
      "w": 150,
      "h": 70,
      "alignment": AnchorType.LeftTop,
      "url": intImage
    })
  ]);
  const group = new Group().addChild([
    new Rectangle({
      "left": 50,
      "top": 50,
      "width": 200,
      "height": 200,
      "linestyle": {
        "color": KnownColors.DarkGray,
        "pixelsnapmode": { "x": true, "y": true }
      },
      "fillstyle": KnownColors.LightBlue
    }),
    groupToClip
  ]);
  return new Plot({
    "canvaselement": canvas,
    "root": group
  });
}
export { createScene };

createScene(document.querySelector('[ref="plot"]'));
# Opacity
Group can have opacity, which can be applied to background, border and all children. Also opacity is supported by all shapes inherited from AbstractNode.
import { Rectangle } from "@int/geotoolkit/scene/shapes/Rectangle.ts";
import { Plot } from "@int/geotoolkit/plot/Plot.ts";
import { Group } from "@int/geotoolkit/scene/Group.ts";
import { KnownColors } from "@int/geotoolkit/util/ColorUtil.ts";
function createScene(canvas) {
  const opacityGroup = new Group({
    "linestyle": {
      "color": KnownColors.DarkGray,
      "pixelsnapmode": true
    },
    "bounds": {
      "x": 100,
      "y": 100,
      "width": 100,
      "height": 100
    },
    "fillstyle": KnownColors.Blue
  }).setOpacity(0.7);
  const rootGroup = new Group().addChild([
    new Rectangle({
      "left": 50,
      "top": 125,
      "width": 200,
      "height": 50,
      "linestyle": {
        "color": KnownColors.DarkGray,
        "pixelsnapmode": { "x": true, "y": true }
      },
      "fillstyle": KnownColors.Orange
    }),
    opacityGroup
  ]);
  return new Plot({
    "canvaselement": canvas,
    "root": rootGroup
  });
}
export { createScene };

createScene(document.querySelector('[ref="plot"]'));
# Flipped Transform
Groups can be flipped by calling setVerticalFlip or setHorizontalFlip.
import { Image } from "@int/geotoolkit/scene/shapes/Image.ts";
import { AnchorType } from "@int/geotoolkit/util/AnchorType.ts";
import { Rect } from "@int/geotoolkit/util/Rect.ts";
import { Plot } from "@int/geotoolkit/plot/Plot.ts";
import { Group } from "@int/geotoolkit/scene/Group.ts";
import { KnownColors } from "@int/geotoolkit/util/ColorUtil.ts";
import intImage from "/src/assets/images/slb-134x80.png?import";
function createScene(canvas) {
  const group = new Group().setBounds(new Rect(0, 0, 180, 180)).setFillStyle(KnownColors.LightGray).addChild([
    new Image({
      "x": 90,
      "y": 90,
      "w": 160,
      "h": 70,
      "alignment": AnchorType.Center,
      "url": intImage
    })
  ]);
  const rootGroup = new Group().addChild([
    group.clone().translate(10, 10).setLineStyle({
      "color": KnownColors.Green,
      "pixelsnapmode": { "x": true, "y": true }
    }),
    group.clone().translate(10 + group.getBounds().getWidth() + 15, 10).setLineStyle({
      "color": KnownColors.Blue,
      "pixelsnapmode": { "x": true, "y": true }
    }).setVerticalFlip(true),
    group.clone().translate(10, 10 + group.getBounds().getHeight() + 15).setLineStyle({
      "color": KnownColors.Yellow,
      "pixelsnapmode": { "x": true, "y": true }
    }).setHorizontalFlip(true),
    group.clone().translate(10 + group.getBounds().getWidth() + 15, 10 + group.getBounds().getHeight() + 15).setLineStyle({
      "color": KnownColors.Orange,
      "pixelsnapmode": { "x": true, "y": true }
    }).setVerticalFlip(true).setHorizontalFlip(true)
  ]);
  return new Plot({
    "canvaselement": canvas,
    "root": rootGroup
  });
}
export { createScene };

createScene(document.querySelector('[ref="plot"]'));
# Content Orientation
Content orientation can be changed by calling setContentOrientation.
import { AnchorType } from "@int/geotoolkit/util/AnchorType.ts";
import { Orientation } from "@int/geotoolkit/util/Orientation.ts";
import { LabelPosition, TickPosition } from "@int/geotoolkit/axis/TickInfo.ts";
import { Rect } from "@int/geotoolkit/util/Rect.ts";
import { Point } from "@int/geotoolkit/util/Point.ts";
import { Plot } from "@int/geotoolkit/plot/Plot.ts";
import { Group } from "@int/geotoolkit/scene/Group.ts";
import { Line } from "@int/geotoolkit/scene/shapes/Line.ts";
import { Spline } from "@int/geotoolkit/scene/shapes/Spline.ts";
import { Text } from "@int/geotoolkit/scene/shapes/Text.ts";
import { Axis } from "@int/geotoolkit/axis/Axis.ts";
import { KnownColors } from "@int/geotoolkit/util/ColorUtil.ts";
function createScene(canvas) {
  const xAxis = new Axis().setTitleVisible(true).setTitleText("X Axis").setTitleAnchor(AnchorType.Center).setTitleTextStyle("black").setBounds(new Rect(0, -30, 200, 0)).setModelLimits(new Rect(0, -30, 200, 0)).setOrientation(Orientation.Horizontal).setTickPosition(TickPosition.Right).setLabelPosition(LabelPosition.Center);
  xAxis.getTickGenerator().setVisibleTickGrade("EDGE", false).setVisibleTickGrade("MAJOR", true).setVisibleTickGrade("MINOR", true).setTickStyle("MINOR", "black").setTickStyle("MAJOR", "black");
  const yAxis = new Axis().setTitleVisible(true).setTitleText("Y Axis").setTitleAnchor(AnchorType.Center).setTitleTextStyle("black").setBounds(new Rect(-60, 0, 0, 100)).setModelLimits(new Rect(-60, 0, 0, 100)).setOrientation(Orientation.Vertical).setTickPosition(TickPosition.Right).setLabelPosition(LabelPosition.Center);
  yAxis.getTickGenerator().setVisibleTickGrade("EDGE", false).setVisibleTickGrade("MAJOR", true).setVisibleTickGrade("MINOR", true).setTickStyle("MINOR", "black").setTickStyle("MAJOR", "black");
  const modelSpace = new Rect(-60, -30, 250, 150);
  const group = new Group().setModelLimits(modelSpace).setBounds(new Rect(0, 0, 180, 180)).setFillStyle(KnownColors.LightGray).addChild([
    xAxis,
    new Line({
      "from": new Point(0, 0),
      "to": new Point(210, 0),
      "visible": true,
      "linestyle": {
        "color": KnownColors.Black,
        "width": 2,
        "pixelsnapmode": true
      }
    }),
    yAxis,
    new Line({
      "from": new Point(0, 0),
      "to": new Point(0, 120),
      "visible": true,
      "linestyle": {
        "color": KnownColors.Black,
        "width": 2,
        "pixelsnapmode": true
      }
    }),
    new Spline({
      "x": [5, 50, 100, 150, 200],
      "y": [10, 30, 100, 10, 60],
      "linestyle": {
        "color": KnownColors.Blue,
        "width": 2
      }
    })
  ]);
  const label = new Text({
    "text": "Default<br/>orientation",
    "ax": modelSpace.getCenterX(),
    "ay": modelSpace.getCenterY(),
    "sizeisindevicespace": true,
    "showellipsis": false,
    "alignment": AnchorType.Center,
    "preservereadingorientation": true,
    "preserverightangle": true
  });
  const rootGroup = new Group().addChild([
    group.clone().translate(10, 10).setLineStyle({
      "color": KnownColors.Black,
      "pixelsnapmode": { "x": true, "y": true }
    }).addChild([
      label
    ]),
    new Group().translate(200, 0).addChild([
      group.clone().addChild([
        label.clone().setText("Horizontal<br/>orientation").rotate(-Math.PI / 2, modelSpace.getCenterX(), modelSpace.getCenterY())
      ]).translate(10, 10).setLineStyle({
        "color": KnownColors.Green,
        "pixelsnapmode": { "x": true, "y": true }
      }).setContentOrientation(Orientation.Horizontal),
      group.clone().addChild([
        label.clone().setText("Horizontal<br/>& V-flipped").rotate(Math.PI / 2, modelSpace.getCenterX(), modelSpace.getCenterY())
      ]).translate(10 + group.getBounds().getWidth() + 15, 10).setLineStyle({
        "color": KnownColors.Blue,
        "pixelsnapmode": { "x": true, "y": true }
      }).setContentOrientation(Orientation.Horizontal).setVerticalFlip(true),
      group.clone().addChild([
        label.clone().setText("Horizontal<br/>& H-flipped").rotate(-Math.PI / 2, modelSpace.getCenterX(), modelSpace.getCenterY())
      ]).translate(10, 10 + group.getBounds().getHeight() + 15).setLineStyle({
        "color": KnownColors.Yellow,
        "pixelsnapmode": { "x": true, "y": true }
      }).setContentOrientation(Orientation.Horizontal).setHorizontalFlip(true),
      group.clone().addChild([
        label.clone().setText("Horizontal<br/>& HV-flipped").rotate(Math.PI / 2, modelSpace.getCenterX(), modelSpace.getCenterY())
      ]).translate(10 + group.getBounds().getWidth() + 15, 10 + group.getBounds().getHeight() + 15).setLineStyle({
        "color": KnownColors.Orange,
        "pixelsnapmode": { "x": true, "y": true }
      }).setContentOrientation(Orientation.Horizontal).setHorizontalFlip(true).setVerticalFlip(true)
    ])
  ]);
  return new Plot({
    "canvaselement": canvas,
    "root": rootGroup
  });
}
export { createScene };

createScene(document.querySelector('[ref="plot"]'));
# Rotated Transform
Calling rotate() on an object will multiply its transformation by a rotation instance.
import { Image } from "@int/geotoolkit/scene/shapes/Image.ts";
import { SymbolShape } from "@int/geotoolkit/scene/shapes/SymbolShape.ts";
import { DiamondPainter } from "@int/geotoolkit/scene/shapes/painters/DiamondPainter.ts";
import { AnchorType } from "@int/geotoolkit/util/AnchorType.ts";
import { Rectangle } from "@int/geotoolkit/scene/shapes/Rectangle.ts";
import { Plot } from "@int/geotoolkit/plot/Plot.ts";
import { Group } from "@int/geotoolkit/scene/Group.ts";
import { KnownColors } from "@int/geotoolkit/util/ColorUtil.ts";
import intImage from "/src/assets/images/slb-134x80.png?import";
function createScene(canvas) {
  const group = new Group().addChild([
    new Rectangle({
      "left": 150,
      "top": 20,
      "width": 169,
      "height": 70,
      "linestyle": KnownColors.Gray,
      "fillstyle": KnownColors.LightBlue
    }),
    new Image({
      "x": 150,
      "y": 20,
      "w": 169,
      "h": 70,
      "alignment": AnchorType.LeftTop,
      "url": intImage
    }).rotate(Math.PI / 4, 150, 20),
    new SymbolShape({
      "ax": 150,
      "ay": 20,
      "width": 10,
      "height": 10,
      "alignment": AnchorType.Center,
      "sizeisindevicespace": false,
      "painter": DiamondPainter,
      "fillstyle": KnownColors.Orange
    })
  ]);
  return new Plot({
    "canvaselement": canvas,
    "root": group
  });
}
export { createScene };

createScene(document.querySelector('[ref="plot"]'));
# Box Model
The four concentric rectangles appear conceptually as below.
When using margins and padding, every layoutable is treated as a box with four concentric rectangles: the margin rectangle, the border rectangle, the padding rectangle, and the content rectangle.
import { CssLayout } from "@int/geotoolkit/layout/CssLayout.ts";
import { Patterns } from "@int/geotoolkit/attributes/LineStyle.ts";
import { Rectangle } from "@int/geotoolkit/scene/shapes/Rectangle.ts";
import { Rect } from "@int/geotoolkit/util/Rect.ts";
import { Plot } from "@int/geotoolkit/plot/Plot.ts";
import { Group } from "@int/geotoolkit/scene/Group.ts";
import { KnownColors } from "@int/geotoolkit/util/ColorUtil.ts";
function createScene(canvas) {
  const root = new Group().setLayout(new CssLayout()).addChild(new Group({
    "margins": {
      "left": 0,
      "right": 0,
      "bottom": 0,
      "top": 0
    },
    "layoutstyle": {
      "top": 10,
      "bottom": 10,
      "left": 10,
      "right": 10
    },
    "linestyle": {
      "color": KnownColors.Gray,
      "pattern": Patterns.Dash
    },
    "fillstyle": null
  })).addChild(new Group({
    "layoutstyle": {
      "top": 10,
      "bottom": 10,
      "left": 10,
      "right": 10
    },
    "margins": {
      "left": 20,
      "right": 20,
      "bottom": 20,
      "top": 20
    },
    "linestyle": KnownColors.Blue,
    "fillstyle": KnownColors.LightGray
  })).addChild(new Group({
    "modellimits": new Rect(0, 0, 100, 100),
    "layoutstyle": {
      "top": 10,
      "bottom": 10,
      "left": 10,
      "right": 10
    },
    "margins": {
      "left": 20,
      "right": 20,
      "bottom": 20,
      "top": 20
    },
    "padding": {
      "left": 20,
      "right": 20,
      "bottom": 20,
      "top": 20
    },
    "linestyle": KnownColors.Red,
    "fillstyle": KnownColors.Blue
  }).addChild(new Rectangle({
    "left": 0,
    "top": 0,
    "width": 100,
    "height": 100,
    "linestyle": KnownColors.Yellow,
    "fillstyle": KnownColors.Yellow
  })));
  return new Plot({
    "canvaselement": canvas,
    "root": root
  });
}
export { createScene };

createScene(document.querySelector('[ref="plot"]'));