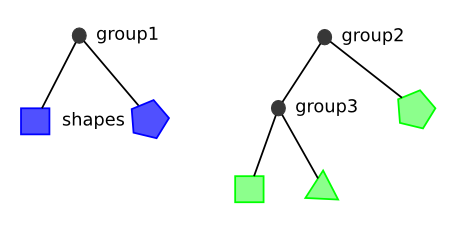
Groups are containers for nodes in the scene graph. Nodes may be either shapes or groups, and are arranged in a hierarchical graph (the scene graph).
A group has bounds which specify its position and size in the parent coordinates. A group also has inner model coordinates. All children nodes use inner model coordinates to specify their location inside the group. All transforms applied to a group will be applied to the group's children. Groups are created by calling the constructor, and then adding children. If a group is meant to change its children, the group's transform can be modified or its bounds and model limits can be set.
# Creating A Root Group
By default, when a group is created it will have bounds and model limits equal to its parent. In this example, the group parent is the plot. Thus, the group will have bounds and model limits equal to the plot size.
import { Rectangle } from "@int/geotoolkit/scene/shapes/Rectangle.ts";
import { Plot } from "@int/geotoolkit/plot/Plot.ts";
import { Group } from "@int/geotoolkit/scene/Group.ts";
import { KnownColors } from "@int/geotoolkit/util/ColorUtil.ts";
function createScene(canvas) {
  const rectangle = new Rectangle(50, 100, 200, 200).setFillStyle(KnownColors.Gray);
  const group = new Group().setAutoModelLimitsMode(true).setLineStyle({
    "color": "LightGray",
    "pixelsnapmode": true
  }).addChild(rectangle);
  return new Plot({
    "canvaselement": canvas,
    "root": group
  });
}
export { createScene };

createScene(document.querySelector('[ref="plot"]'));
# Model Limits and Bounds
Groups inner space is created with setModelLimits, while their outer coordinates are set with setBounds. Groups will transform items in their model space onto their bounds. This is illustrated with an axis in the example below. The group's model limits are from 0-500, and its bounds are from 100-300. The below demo illustrates how a group's model space relates to coordinates in its parents model space.
import { Text } from "@int/geotoolkit/scene/shapes/Text.ts";
import { AnchorType } from "@int/geotoolkit/util/AnchorType.ts";
import { Rectangle } from "@int/geotoolkit/scene/shapes/Rectangle.ts";
import { PointerMode } from "@int/geotoolkit/controls/tools/PointerMode.ts";
import { Rect } from "@int/geotoolkit/util/Rect.ts";
import { Plot } from "@int/geotoolkit/plot/Plot.ts";
import { Group } from "@int/geotoolkit/scene/Group.ts";
import { KnownColors } from "@int/geotoolkit/util/ColorUtil.ts";
import { Tools } from "@int/geotoolkit/controls/tools/Tools.ts";
import { init } from "@int/geotoolkit/base.js";
init({ "imports": [Tools] });
function createScene(canvas, innerLabel, outerLabel) {
  const innerGroup = new Group().setBounds(new Rect(100, 100, 300, 300)).setModelLimits(new Rect(0, 0, 500, 500)).setLineStyle({
    "color": "black",
    "pixelsnapmode": true
  }).addChild([
    new Rectangle(0, 0, 500, 500).setFillStyle(KnownColors.Orange)
  ]);
  const topLeftLabel = new Text("100, 100", 100, 100, 50, 20).setAnchorType(AnchorType.LeftTop);
  const rightBottomLabel = new Text("300, 300", 300, 300, 50, 20).setAnchorType(AnchorType.RightBottom);
  const parentGroup = new Group().setLineStyle({
    "color": "LightGray",
    "pixelsnapmode": true
  }).setBounds(new Rect(0, 0, 400, 400)).setModelLimits(new Rect(0, 0, 400, 400)).addChild([
    innerGroup,
    topLeftLabel,
    rightBottomLabel
  ]).on(PointerMode.Hover, (type, node, args) => {
    const plotPoint = args.getPlotPoint();
    const modelPoint = innerGroup.getContentsTransform().createInverse().transformPoint(plotPoint);
    innerLabel.innerHTML = "( " + modelPoint.getX().toFixed(2) + " ; " + modelPoint.getY().toFixed(2) + " )";
    outerLabel.innerHTML = "( " + plotPoint.getX().toFixed(2) + " ; " + plotPoint.getY().toFixed(2) + " )";
  });
  return new Plot({
    "canvaselement": canvas,
    "root": parentGroup
  });
}
export { createScene };

createScene(document.querySelector('[ref="plot"]'), document.querySelector('[ref="innerGroup"]'), document.querySelector('[ref="outerGroup"]'));