This WellLog tutorial demonstrates how to create WellLog data visualizations. This tutorial assumes familiarity with the separate tutorial WellLog Introduction . The default WellLog widget has a track container, header container, several default tools and built-in functions. Users can take full advantage of these widget functions and effortlessly add any needed tracts and visuals.
The WellLog widget is configured using options provided in the constructor or setOptions() can be called after construction. The widget content is manipulated through add/remove/get-track(). The track content is controlled through track.add/remove/get-Child(). GeoToolkit provides an API to connect data, which can be located on different servers. Refer to the WellLog - Data Connection tutorial for details.
The widget also provides built-in support for time/depth modes, resizing headers and footers, selection and highlighting, track resizing and supports several default tools. Headers are displayed by default and their attributes can be modified very easily. The WellLog widget allows creating custom WellLog visuals, Composite Markers and MarkerSet , for example. For more details, refer to geotoolkit/welllog/widgets/WellLogWidget in the API.
# Initialization
The first step is to create the WellLog widget. Then, add visuals to the track and add the tracts to the widget. Finally, insert the widget in the plot.
.cg-tooltip-holder {
  position: relative;
}

.cg-tooltip {
  position: absolute;
  display: block;
  padding: 2px 12px 3px 7px;
  overflow: visible !important;
  font-family: Roboto, Helvetica, Arial, sans-serif;
  font-size: 13px;
  background: white !important;
  opacity: 0.9;
  color: #333333;
  border: solid 1px gray;
  border-radius: 5px;
  text-align: left;
  box-shadow: 0 4px 8px 0 rgba(0, 0, 0, 0.2), 0 6px 20px 0 rgba(0, 0, 0, 0.19);
  border-radius: 5px;
  margin: 0 !important;
  z-index: 10000;
  max-width: 400px;
  text-wrap: normal !important;
  white-space: normal !important;
}
/* Default setting for tooltip */
.cg-tooltip-container {
  position: absolute;
  display: block;
  overflow: visible !important;
  font-family: Roboto, Helvetica, Arial, sans-serif;
  font-size: 12px;
  padding: 3px 7px;
  background: #f7f7f7;
  color: #333333;
  border: 1px solid #938e8e;
  opacity: 0.8;
  text-align: left;
  box-shadow: 3px 3px 10px #888;
  margin: 0 !important;
  z-index: 10000;
  max-width: 400px;
  text-wrap: normal !important;
  white-space: normal !important;
  user-select: none;
}
@media screen and (-ms-high-contrast: active), (-ms-high-contrast: none) {
  .cg-tooltip-container {
    border-radius: 0;
  }
}
/* Default left arrow for tooltip */
.cg-tooltip-arrow-left::before {
  content: '';
  position: absolute;
  display: block;
  width: 0px;
  left: 0;
  top: 50%;
  border: 5px solid transparent;
  border-left: 0;
  border-right: 5px solid  #938e8e;
  transform: translate(calc(-100%), -50%);
}
.cg-tooltip-arrow-left::after {
  content: '';
  position: absolute;
  display: block;
  width: 0px;
  left: 0;
  top: 50%;
  border: 4px solid transparent;
  border-left: 0;
  border-right: 4px solid #f7f7f7;
  transform: translate(calc(-100%), -50%);
}
/* Default top arrow for tooltip */
.cg-tooltip-arrow-top::before {
  content: '';
  position: absolute;
  display: block;
  width: 0px;
  left: 50%;
  top: 0;
  border: 5px solid transparent;
  border-top: 0;
  border-bottom: 5px solid #938e8e;
  transform: translate(-50%, -100%);
}
.cg-tooltip-arrow-top::after {
  content: '';
  position: absolute;
  display: block;
  width: 0px;
  left: 50%;
  top: 0;
  border: 4px solid transparent;
  border-top: 0;
  border-bottom: 4px solid #f7f7f7;
  transform: translate(-50%, -100%);
}
/* Default right arrow for tooltip */
.cg-tooltip-arrow-right::before {
  content: '';
  position: absolute;
  display: block;
  width: 0px;
  right: 0;
  top: 50%;
  border: 5px solid transparent;
  border-right: 0;
  border-left: 5px solid #938e8e;
  transform: translate(100%, -50%);
}
.cg-tooltip-arrow-right::after {
  content: '';
  position: absolute;
  display: block;
  width: 0px;
  right: 0;
  top: 50%;
  border: 4px solid transparent;
  border-right: 0;
  border-left: 4px solid #f7f7f7;
  transform: translate(100%, -50%);
}
/* Default bottom arrow for tooltip */
.cg-tooltip-arrow-bottom::before {
  content: '';
  position: absolute;
  display: block;
  width: 0px;
  left: 50%;
  bottom: 0px;
  border: 5px solid transparent;
  border-bottom: 0;
  border-top: 5px solid #938e8e;
  transform: translate(-50%, 100%);
  z-index: 10000;
}
.cg-tooltip-arrow-bottom::after {
  content: '';
  position: absolute;
  display: block;
  width: 0px;
  left: 50%;
  bottom: 0;
  border: 4px solid transparent;
  border-bottom: 0;
  border-top: 4px solid #f7f7f7;
  transform: translate(-50%, 100%);
  z-index: 10000;
}
/* Tooltip item name */
/* Tooltip item value */
/* .cg-tooltip-item-value */
/* Tooltip item value */
.cg-tooltip-item-unit {
  text-transform: none;
}

.cg-tooltip-item-name {
    text-transform: capitalize;
    white-space: nowrap;
    vertical-align: middle;
    font-size: 13px;
}
.cg-tooltip-row {
  display: flex;
  flex-direction: row;
  align-items: center;
  white-space: pre-wrap;
  font-size: 12px;
  line-height: 100%;
  margin: 1px 0;
}
.cg-tooltip-title {
  font-size: 13px;
  height: 14px;
  text-transform: capitalize;
}
.cg-tooltip-title .cg-tooltip-symbol {
  margin-right: 0 !important;
}
.cg-tooltip-title-name {
  vertical-align: middle;
}
.cg-tooltip-row + .cg-tooltip-row {
  margin-top: 4px;
}
.cg-tooltip-row.cg-tooltip-title + .cg-tooltip-row {
  margin-top: 5px;
}
.cg-tooltip-item-value + .cg-tooltip-item-unit {
    margin-left: 1px;
}
/* Tooltip symbol */
.cg-tooltip-symbol-cell {
  display: inline-flex;
  min-width: 13px; /* 10px size + 3px margin */
}
.cg-tooltip-symbol {
  margin-right: 3px;
  background-color: transparent;
  display: block;
}
.cg-tooltip-symbol > img {
  display: block;
}
.cg-tooltip-list-cell {
  display: inline-flex;
}
.cg-tooltip-list-symbol {
  display: block;
  margin-right: 3px;
  width: 6px;
  height: 6px;
  vertical-align: middle;
  border-radius: 50%;
  border: 1px solid rgba(0,0,0,.4);
}
.cg-tooltip-symbol-legacy {
  border-radius: 4px;
  margin-right: 5px;
  height: 8px;
  width: 8px;
  display: inline-block;
}
.cg-tooltip-title-legacy {
  font-weight: 900;
}

/* Tooltip symbol circle */
.cg-tooltip-symbol.circle {
  height: 10px;
  width: 10px;
  display: inline-block;
  border-radius: 50%;
  border: 1px solid rgba(0,0,0,.4);
}
/* Tooltip symbol line */
.cg-tooltip-symbol.line {
    height: 10px;
    width: 10px;
    display: inline-block;
    transform: scale(1.2, 0.2);
}
/* Tooltip symbol diamond */
.cg-tooltip-symbol.diamond {
    height: 10px;
    width: 10px;
    display: inline-block;
    transform: rotate(45deg);
    border-radius: 0px;
}
/* Tooltip symbol square */
.cg-tooltip-symbol.square {
    height: 10px;
    width: 10px;
    display: inline-block;
    border-radius: 0px;
    border: 1px solid rgba(0,0,0,.4);
}
# Customization
The following example shows how to add a footer and a custom axis header, how to customize scrollbars and to disable track/plot resizing and cross-hair tool.
import { Plot } from "@int/geotoolkit/plot/Plot.ts";
import { WellLogWidget } from "@int/geotoolkit/welllog/widgets/WellLogWidget.ts";
import { BorderStrategy } from "@int/geotoolkit/welllog/BorderStrategy.ts";
import { TrackType } from "@int/geotoolkit/welllog/TrackType.ts";
import { HeaderType } from "@int/geotoolkit/welllog/header/LogAxisVisualHeader.ts";
import { LogAxis } from "@int/geotoolkit/welllog/LogAxis.ts";
import { createCurve } from "/src/code/WellLog/utils/curveData.ts";
function initializeCustomAxisHeader(widget) {
  const axisHeader = widget.getHeaderContainer().getHeaderProvider().getHeaderProvider(LogAxis.getClassName()).clone();
  axisHeader.setHeaderType(HeaderType.Custom).setFormatHeaderHandler((sender, axis) => {
    const track = axis.getTrack();
    const visibleHeight = Math.round(track.getVisibleModelLimits().getHeight() * 100) / 100;
    const unitInfo = track.getUnitInfo();
    return "Depth<br><br>Visible<br>" + visibleHeight + (unitInfo ? "<br>(" + unitInfo.getIndexUnit().getSymbol() + ")" : "");
  });
  widget.getHeaderContainer().getHeaderProvider().registerHeaderProvider(LogAxis.getClassName(), axisHeader);
}
function createScene(canvas) {
  const widget = new WellLogWidget({
    "footer": {
      "visible": true
    },
    "trackcontainer": {
      "border": {
        "visible": true
      },
      "track": {
        "borderstrategy": BorderStrategy.BorderOnTop
      }
    },
    "border": {
      "visible": true
    },
    "scroll": {
      "headerverticalscroll": {
        "size": 11,
        "visible": false,
        "options": {
          "rounded": true,
          "resizable": false
        }
      },
      "trackverticalscroll": {
        "size": 11,
        "visible": false,
        "options": {
          "rounded": true,
          "resizable": false
        }
      },
      "footerverticalscroll": {
        "size": 11,
        "visible": false,
        "options": {
          "rounded": true,
          "resizable": false
        }
      },
      "trackhorizontalscroll": {
        "size": 11,
        "visible": false,
        "options": {
          "rounded": true,
          "resizable": false
        }
      }
    },
    "tools": {
      "tracksplitter": {
        "enabled": false
      },
      "cursortracking": {
        "crosshair": {
          "enabled": false
        },
        "tooltip": {
          "enabled": true
        }
      }
    }
  });
  initializeCustomAxisHeader(widget);
  widget.addTrack(TrackType.IndexTrack);
  widget.addTrack(TrackType.LinearTrack).addChild([
    createCurve(4500, 10, "GR", "#7cb342"),
    createCurve(4500, 10, "CALI", "#ef6c00")
  ]);
  widget.addTrack(TrackType.LinearTrack).addChild([
    createCurve(4500, 10, "DLT", "#7cb342"),
    createCurve(4500, 10, "RILD", "#ef6c00")
  ]);
  widget.addTrack(TrackType.LinearTrack).addChild([
    createCurve(4500, 10, "SP", "#7cb342"),
    createCurve(4500, 10, "RHOB", "#ef6c00")
  ]);
  widget.addTrack(TrackType.IndexTrack);
  widget.setHeaderHeight("auto");
  return new Plot({
    "canvaselement": canvas,
    "root": widget
  });
}
export { createScene };

createScene(document.querySelector('[ref="plot"]'));
# Custom Annotations
WellLog widget has customized side annotations. The following table shows available side annotations in the WellLog widget.
| Side Annotations | Preview |
|---|---|
| 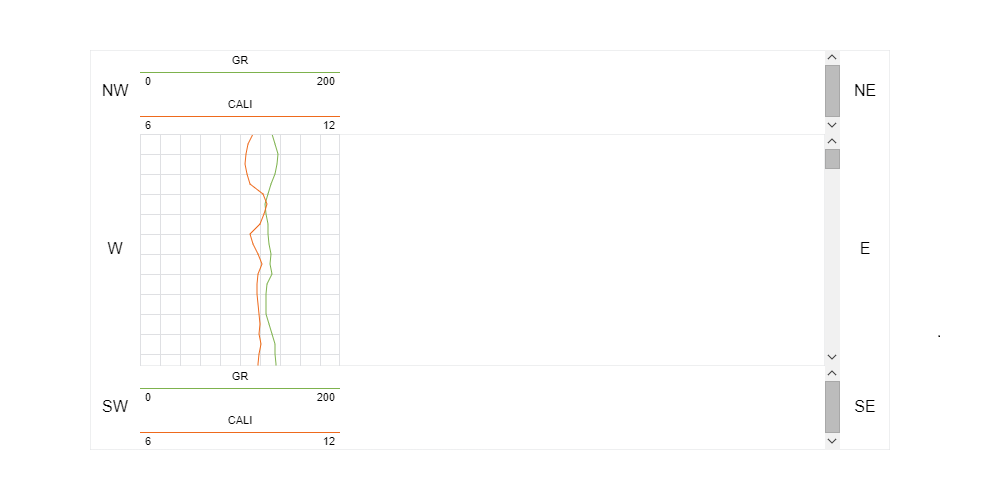 |
The following example shows how to add a custom axis and a title into the side annotations.
import { Plot } from "@int/geotoolkit/plot/Plot.ts";
import { WellLogWidget } from "@int/geotoolkit/welllog/widgets/WellLogWidget.ts";
import { TrackType } from "@int/geotoolkit/welllog/TrackType.ts";
import { HeaderType } from "@int/geotoolkit/welllog/header/LogAxisVisualHeader.ts";
import { Text } from "@int/geotoolkit/scene/shapes/Text.ts";
import { AnchorType } from "@int/geotoolkit/util/AnchorType.ts";
import { Orientation } from "@int/geotoolkit/util/Orientation.ts";
import { AnnotationLocation } from "@int/geotoolkit/layout/AnnotationLocation.ts";
import { AxisFactory } from "@int/geotoolkit/axis/AxisFactory.ts";
import { BorderStrategy } from "@int/geotoolkit/welllog/BorderStrategy.ts";
import { createCurve } from "/src/code/WellLog/utils/curveData.ts";
function createScene(canvas) {
  const title = createTextShape("Depth");
  const axisWest = AxisFactory.getInstance().create({
    "location": AnnotationLocation.West
  });
  axisWest.getTickGenerator().setMinSpanGrade("major").setMinSpan(50);
  const widget = new WellLogWidget({
    "annotations": {
      "west": [axisWest],
      "northwest": [title]
    },
    "annotationssizes": {
      "west": 50
    },
    "trackcontainer": {
      "border": {
        "visible": true
      },
      "track": {
        "borderstrategy": BorderStrategy.BorderOnTop
      }
    },
    "border": {
      "visible": true
    },
    "horizontalscrollable": false,
    "verticalscrollable": true,
    "tools": {
      "cursortracking": {
        "tooltip": {
          "enabled": true
        }
      }
    }
  }).setAxisHeaderType(HeaderType.Simple).connect(axisWest, Orientation.Vertical);
  widget.addTrack(TrackType.LinearTrack).addChild([
    createCurve(4500, 10, "GR", "#7cb342"),
    createCurve(4500, 10, "CALI", "#ef6c00")
  ]);
  widget.setHeaderHeight("auto");
  return new Plot({
    "canvaselement": canvas,
    "root": widget
  });
}
function createTextShape(text) {
  return new Text({
    "text": text,
    "alignment": AnchorType.Center,
    "textstyle": {
      "font": "normal 16px Arial"
    }
  });
}
export { createScene };

createScene(document.querySelector('[ref="plot"]'));
# Track Width
The following code shows how to change track width after initialization.
import { Plot } from "@int/geotoolkit/plot/Plot.ts";
import { WellLogWidget } from "@int/geotoolkit/welllog/widgets/WellLogWidget.ts";
import { TrackType } from "@int/geotoolkit/welllog/TrackType.ts";
import { BorderStrategy } from "@int/geotoolkit/welllog/BorderStrategy.ts";
import { HeaderType } from "@int/geotoolkit/welllog/header/LogAxisVisualHeader.ts";
import { createCurve } from "/src/code/WellLog/utils/curveData.ts";
function createScene(canvas) {
  const widget = new WellLogWidget({
    "footer": {
      "visible": true
    },
    "trackcontainer": {
      "border": {
        "visible": true
      },
      "track": {
        "borderstrategy": BorderStrategy.BorderOnTop
      }
    },
    "border": {
      "visible": true
    },
    "scroll": {
      "headerverticalscroll": {
        "size": 11,
        "visible": false,
        "options": {
          "rounded": true,
          "resizable": false
        }
      },
      "trackverticalscroll": {
        "size": 11,
        "visible": false,
        "options": {
          "rounded": true,
          "resizable": false
        }
      },
      "footerverticalscroll": {
        "size": 11,
        "visible": false,
        "options": {
          "rounded": true,
          "resizable": false
        }
      },
      "trackhorizontalscroll": {
        "size": 11,
        "visible": false,
        "options": {
          "rounded": true,
          "resizable": false
        }
      }
    },
    "tools": {
      "tracksplitter": {
        "enabled": false
      },
      "cursortracking": {
        "crosshair": {
          "enabled": false
        },
        "tooltip": {
          "enabled": true
        }
      }
    }
  }).setAxisHeaderType(HeaderType.Simple);
  widget.addTrack(TrackType.IndexTrack);
  widget.addTrack(TrackType.LinearTrack).addChild([
    createCurve(4500, 10, "GR", "#7cb342"),
    createCurve(4500, 10, "CALI", "#ef6c00")
  ]).setWidth(100);
  widget.addTrack(TrackType.IndexTrack);
  widget.addTrack(TrackType.LinearTrack).addChild([
    createCurve(4500, 10, "DLT", "#7cb342"),
    createCurve(4500, 10, "RILD", "#ef6c00")
  ]);
  widget.addTrack(TrackType.IndexTrack);
  widget.addTrack(TrackType.LinearTrack).addChild([
    createCurve(4500, 10, "SP", "#7cb342"),
    createCurve(4500, 10, "RHOB", "#ef6c00")
  ]);
  widget.addTrack(TrackType.IndexTrack);
  widget.setHeaderHeight("auto");
  return new Plot({
    "canvaselement": canvas,
    "root": widget
  });
}
export { createScene };

createScene(document.querySelector('[ref="plot"]'));
# Custom Tool
The following code shows how to customice default tooltip.
import { Plot } from "@int/geotoolkit/plot/Plot.ts";
import { LogCurve } from "@int/geotoolkit/welllog/LogCurve.ts";
import { WellLogWidget } from "@int/geotoolkit/welllog/widgets/WellLogWidget.ts";
import { TrackType } from "@int/geotoolkit/welllog/TrackType.ts";
import { LogToolTipRegistry } from "@int/geotoolkit/welllog/tooltip/LogToolTipRegistry.ts";
import { createCurve } from "/src/code/WellLog/utils/curveData.ts";
function createScene(canvas, tooltip) {
  const registry = LogToolTipRegistry.getDefaultInstance().clone(true);
  registry.getToolTipFormatter(LogCurve.getClassName()).setFormat([
    'Color: <span style="color:${color}">${color}</span>',
    "Name: ${name}",
    "Nearest Depth: ${sample.depth}",
    "Nearest Value: ${sample.value:#.0000}",
    "Interpolated Depth: ${index}",
    "Interpolated Value: ${value:#.0000}"
  ].join("<br/>"));
  const widget = new WellLogWidget({
    "border": {
      "visible": true
    },
    "horizontalscrollable": false,
    "verticalscrollable": true,
    "tools": {
      "cursortracking": {
        "tooltip": {
          "enabled": true,
          "registry": registry
        }
      }
    }
  });
  widget.addTrack(TrackType.IndexTrack);
  widget.addTrack(TrackType.LinearTrack).addChild([
    createCurve(4500, 10, "GR", "#7cb342"),
    createCurve(4500, 10, "CALI", "#ef6c00")
  ]);
  widget.setHeaderHeight("auto");
  return new Plot({
    "canvaselement": canvas,
    "root": widget
  });
}
export { createScene };

createScene(document.querySelector('[ref="plot"]'), document.querySelector('[ref="tooltip"]'));
# Rubber Band Zoom Tool
The following code shows how to enable the Rubber Band Zoom tool. The other tools allow Zoom In, Zoom Out, and Fit to Height.
import { Plot } from "@int/geotoolkit/plot/Plot.ts";
import { WellLogWidget } from "@int/geotoolkit/welllog/widgets/WellLogWidget.ts";
import { TrackType } from "@int/geotoolkit/welllog/TrackType.ts";
import { HeaderType } from "@int/geotoolkit/welllog/header/LogAxisVisualHeader.ts";
import { Events as AbstractToolEvents } from "@int/geotoolkit/controls/tools/AbstractTool.ts";
import { Events as SplitterEvents } from "@int/geotoolkit/welllog/widgets/tools/Splitter.ts";
import { createCurve } from "/src/code/WellLog/utils/curveData.ts";
import { Node } from "@int/geotoolkit/scene/Node.ts";
function createScene(canvas) {
  const widget = new WellLogWidget({
    "horizontalscrollable": false,
    "verticalscrollable": true,
    "tools": {
      "cursortracking": {
        "tooltip": {
          "enabled": true
        }
      }
    }
  }).setAxisHeaderType(HeaderType.Simple);
  widget.addTrack(TrackType.IndexTrack).setId("Fixed Track");
  widget.addTrack(TrackType.LinearTrack).addChild([
    createCurve(4500, 10, "GR", "#7cb342"),
    createCurve(4500, 10, "CALI", "#ef6c00")
  ]).setLayoutStyle({
    "minwidth": 150,
    "maxwidth": 200
  });
  widget.addTrack(TrackType.LogTrack).addChild([
    createCurve(4500, 10, "DLT", "#7cb342"),
    createCurve(4500, 10, "RHOB", "#ef6c00")
  ]).setLayoutStyle({
    "minwidth": 150,
    "maxwidth": 200
  });
  widget.getToolByName("cross-hair").setEnabled(false);
  widget.getToolByName("splitter").on(SplitterEvents.onCanResize, (evt, sender, event) => {
    const node = event.getEventTarget();
    if (node instanceof Node && node.getId() === "Fixed Track") {
      event.reject();
    }
  });
  widget.setHeaderHeight("auto");
  return {
    plot: new Plot({
      "canvaselement": canvas,
      "root": widget
    }),
    widget
  };
}
function addRubberBandListener(widget, listener) {
  widget.getToolByName("rubberband").on(AbstractToolEvents.onEnabledStateChanged, listener);
}
function setRubberBandEnabled(widget, enabled) {
  widget.getToolByName("rubberband").setEnabled(enabled);
}
function zoomIn(widget) {
  setRubberBandEnabled(widget, false);
  widget.scale(5 / 4);
}
function zoomOut(widget) {
  setRubberBandEnabled(widget, false);
  widget.scale(4 / 5);
}
function fitToHeight(widget) {
  setRubberBandEnabled(widget, false);
  widget.fitToHeight();
}
export { addRubberBandListener, createScene, fitToHeight, setRubberBandEnabled, zoomIn, zoomOut };

createScene(document.querySelector('[ref="plot"]'));
# Defining Highlights with CSS
CSS styles can be used to specify highlighting behavior, customizing CSS styles for specific object classes.
Keep in mind, if you decided to use 'cssclass': 'highlight' you need to specify CSS rules for all types including visual headers.
import { Plot } from "@int/geotoolkit/plot/Plot.ts";
import { WellLogWidget } from "@int/geotoolkit/welllog/widgets/WellLogWidget.ts";
import { TrackType } from "@int/geotoolkit/welllog/TrackType.ts";
import { createCurve } from "/src/code/WellLog/utils/curveData.ts";
function createScene(canvas) {
  const widget = new WellLogWidget({
    "highlight": {
      "cssclass": "highlight"
    },
    "footer": {
      "visible": false
    },
    "horizontalscrollable": false,
    "verticalscrollable": true,
    "tools": {
      "cursortracking": {
        "tooltip": {
          "enabled": true
        }
      }
    }
  });
  widget.addTrack(TrackType.IndexTrack);
  widget.addTrack(TrackType.LinearTrack).addChild([
    createCurve(4500, 10, "GR", "#2196f3")
  ]);
  widget.addTrack(TrackType.LinearTrack).addChild([
    createCurve(4500, 10, "CALI", "#ef6c00")
  ]);
  const css = `
         .geotoolkit.welllog.LogTrack:highlight {
           fillstyle: rgba(0, 100, 100, 0.1);
           linestyle: 3 solid rgba(0, 100, 100, 1);
        }
        .geotoolkit.welllog.LogCurve:highlight {
           linestyle-width: 4;
        }
        .geotoolkit.welllog.header.AdaptiveLogVisualHeader:highlight {
           fillstyle: rgba(0, 100, 100, 0.1);
           borderlinestyle: 1px solid rgba(0, 100, 100, 1);
        }
    `;
  widget.setCss(css);
  widget.setHeaderHeight("auto");
  return new Plot({
    "canvaselement": canvas,
    "root": widget
  });
}
export { createScene };

createScene(document.querySelector('[ref="plot"]'));
# Collapsed Intervals
This example shows how to create collapsed intervals in the well log.
import { Plot } from "@int/geotoolkit/plot/Plot.ts";
import { WellLogWidget } from "@int/geotoolkit/welllog/widgets/WellLogWidget.ts";
import { TrackType } from "@int/geotoolkit/welllog/TrackType.ts";
import { HeaderType } from "@int/geotoolkit/welllog/header/LogAxisVisualHeader.ts";
import { CollapsedIntervalTool } from "@int/geotoolkit/welllog/widgets/tools/CollapsedIntervalTool.ts";
import { LineDecoration } from "@int/geotoolkit/attributes/LineDecoration.ts";
import { CirclePainter } from "@int/geotoolkit/scene/shapes/painters/CirclePainter.ts";
import { Range } from "@int/geotoolkit/util/Range.ts";
import { createCurve } from "/src/code/WellLog/utils/curveData.ts";
import { AnchorType } from "@int/geotoolkit/util/AnchorType.ts";
function createScene(canvas) {
  const widget = new WellLogWidget({
    "horizontalscrollable": false,
    "verticalscrollable": true,
    "tools": {
      "crosshair": {
        "west": {
          "visible": true,
          "paddingstyle": "5px",
          "offset": 10,
          "linestyle": "black",
          "fillstyle": "white",
          "alignment": AnchorType.LeftBottom
        }
      },
      "cursortracking": {
        "tooltip": {
          "enabled": true
        }
      }
    },
    "collapsed": {
      "intervals": [
        { "range": new Range(3600, 3800), "collapsed": true },
        { "range": new Range(4600, 4700), "collapsed": true },
        { "range": new Range(4820, 5580), "collapsed": false }
      ],
      "marker": {
        "collapsed": {
          "line": {
            "color": "#e64a19",
            "width": 3,
            "decoration": LineDecoration.Solid
          },
          "symbol": {
            "size": 10,
            "painter": CirclePainter,
            "fillstyle": "#1047b9"
          }
        },
        "uncollapsed": {
          "line": {
            "color": "#e64a19",
            "width": 1,
            "decoration": LineDecoration.Solid
          },
          "symbol": {
            "size": 10,
            "painter": CirclePainter,
            "fillstyle": "#1047b9"
          }
        }
      }
    }
  }).setAxisHeaderType(HeaderType.Simple);
  widget.getTool().add(new CollapsedIntervalTool(widget));
  const cali = createCurve(4500, 10, "CALI", "#ef6c00").setNormalizationLimits(6, 20);
  for (let i = 20; i < 25; i++) {
    cali.getDataSource().setValue(i, cali.getDataSource().getValue(i) + 5);
  }
  widget.addTrack(TrackType.IndexTrack);
  widget.addTrack(TrackType.LinearTrack).addChild([
    createCurve(4500, 10, "GR", "#7cb342"),
    cali
  ]);
  widget.addTrack(TrackType.LinearTrack).addChild([
    createCurve(4500, 10, "SP", "#7cb342"),
    createCurve(4500, 10, "RHOB", "#ef6c00")
  ]);
  widget.addTrack(TrackType.IndexTrack);
  widget.setHeaderHeight("auto");
  return {
    plot: new Plot({
      "canvaselement": canvas,
      "root": widget
    }),
    widget
  };
}
function zoomIn(widget) {
  widget.scale(5 / 4);
}
function zoomOut(widget) {
  widget.scale(4 / 5);
}
function fitToHeight(widget) {
  widget.fitToHeight();
}
export { createScene, fitToHeight, zoomIn, zoomOut };

createScene(document.querySelector('[ref="plot"]'));