WellLog is designed to facilitate visualization and analysis of well log data in 2D space. It supports most log data formats and also allows users to create custom plug-ins for data parsers.
The key strength of WellLog is in its powerful WellLog widgets, which are specialized but flexible high level components that can be configured with minimum coding. To master these widgets, it is necessary to understand the basic architecture of WellLog. WellLog displays the log data in the form of curves, fills, lithologies, markers, labels, etc. These forms/shapes are categorized as log visuals. Several different classes for visuals such as log curve, log fill, log2d visual, log lithology, log marker, etc. are included in the API.
These log visuals are added to log tracks. Multiple log visuals can be added to the log tracks to explore multiple wells and streamline their workflows.
Linear and logarithmic log tracks are supported and can be paired with index tracks, axis and grids so the log data can be parsed more easily. These log tracks can then be added to a track container which can hold multiple tracks for easy data analysis.
Several kinds of track headers and visual headers are available to display information related to the visuals/curves contained in each track.
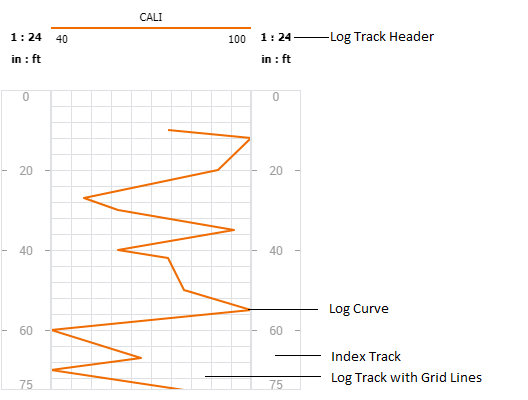
The image below shows a simple WellLog representation with two index/depth tracks, a linear track with a log curve and a track header.
# WellLog Widgets
The WellLog widget combines the track container, header container and several customizable tools to form a complex but easy to manipulate object. The user can effortlessly add/remove log tracks and log visuals to/from the widget. The widget provides built-in support for time/depth modes, manipulating headers and footers, custom headers, selection and highlighting tools, custom tools, track resizing, etc. Orientation of the data can be vertical, horizontal or with a deviation to fit user requirements. See the WellLog Widgets tutorial.
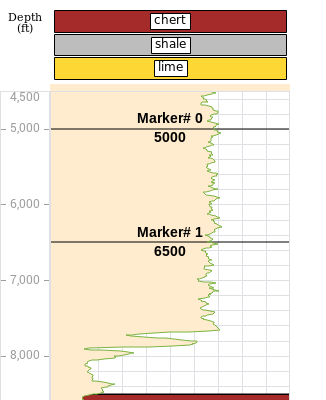
The image below shows how multiple visuals such as log fill, log marker and log curve can be combined in a log track to realistically represent data. Seismic images can also be added to the log track to enable comparing different data sets.
To customize further, combine WellLog widgets with Carnac Chart widgets to synchronize data selections and analyze specific data points.
A seismic image can also be added to the log track to compare different data sets.
Continue with the WellLog Widgets tutorial.